Hello, Sign in
My Account
My Account
New customer? Start here
Understanding assay format, sample compatibility and performance evidence
Choosing an ELISA kit starts with the biological question, not the smallest sensitivity number on a product page. A suitable kit must recognize the intended target, work with the study species and sample preparation, and quantify the concentrations your experiment is likely to produce.
The practical approach is to shortlist kits by target and sample compatibility, compare their supported quantification intervals with your expected concentrations after dilution, then evaluate specificity, validation evidence and workflow requirements.
This guide explains six selection criteria and shows how to apply them in a worked comparison. Use it to evaluate ELISA kits for your research, including options in the ADMEbio catalog. Individual kits have different specifications and procedures; always use the selected kit’s current instructions.
Record the target’s full name, identifier where available, species and molecular form of interest. Closely related proteins or differently modified forms can complicate interpretation: a familiar target name alone does not establish which forms an antibody-based assay recognizes. [1]
An epitope is the part of an antigen recognized by an antibody. Ask whether the kit documentation addresses the distinction your study needs—for example, distinguishing a target from related family members. Cross-reactivity information describes responses to substances other than the intended target. Review which substances were actually tested; “no significant cross-reactivity” is most useful when accompanied by the tested compounds and conditions. [1]
Turn your question into a selection requirement: “Measure this target in this species and sample type, while distinguishing these related substances if relevant.” That is more actionable than simply asking for the most sensitive kit.
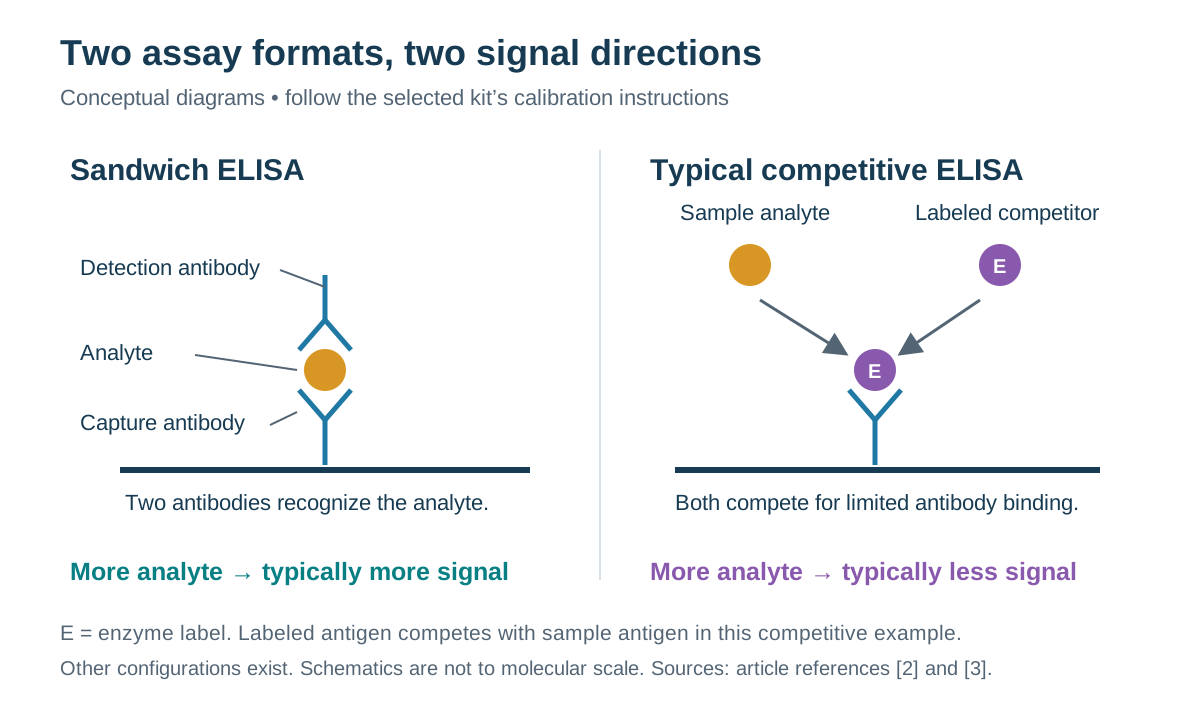
In a sandwich ELISA, a capture antibody binds the analyte and a detection antibody recognizes another epitope. This means the target and antibody pair must support simultaneous recognition. [2] In a typical competitive ELISA, sample analyte competes for antibody binding; increasing analyte concentration produces a lower signal. Competitive formats are often used for small targets that cannot accommodate the antibody pair needed for a sandwich assay. [3]
The practical consequence is that signal direction depends on assay design. A weaker signal can indicate more analyte in a competitive assay. Read concentrations from the selected kit’s calibration procedure rather than interpreting color intensity on its own. [3]
Format is not a ranking of quality. Choose based on the intended measurement and the kit’s evidence. ELISA detection systems can use enzyme-based color development, fluorescence or chemiluminescence. [5] Confirm that your reader supports the detection method and settings specified in the selected kit’s instructions before ordering.
The sample matrix is everything surrounding the analyte: serum, plasma, culture medium or an extract can contain components that affect the assay response. A kit that measures a purified standard successfully may behave differently in a biological sample. Matrix compatibility therefore needs evidence beyond a good-looking standard curve. [1]
Confirm the exact sample type and preparation, including plasma anticoagulant where applicable. Then ask what supporting tests were performed. Three related checks answer different questions:
| Check | What it investigates | What to look for |
|---|---|---|
| Spike recovery | Whether a known amount of added analyte is measured as expected in the sample matrix. | Tested matrices, spike levels and recovery results; consider the unspiked sample’s contribution. |
| Dilutional linearity | Whether samples give consistent dilution-corrected concentrations across suitable dilutions. | Dilutions tested, diluent used and corrected results within the supported range. |
| Parallelism | Whether endogenous analyte’s dilution behavior is comparable with the calibrator’s behavior. | Experiments using naturally present analyte rather than only an added standard. |
These distinctions follow the method-validation framework in [1], which separates endogenous-sample parallelism from spiked-sample dilution testing. Terminology can vary between product documents and scientific publications. Inspect the experimental method rather than relying on the heading alone.
A successful spike test does not establish that an added standard behaves identically to the naturally present target. Different tests contribute complementary evidence. In a published example, researchers evaluated recovery and dilution behavior when applying a commercial T3 ELISA to extracted mouse fecal samples. That study illustrates matrix-specific evaluation; it does not establish compatibility for other kits or preparations. [4]
If your sample is unlisted, request supporting data and plan a small pilot before using a large collection. Follow kit-specific handling and dilution instructions.
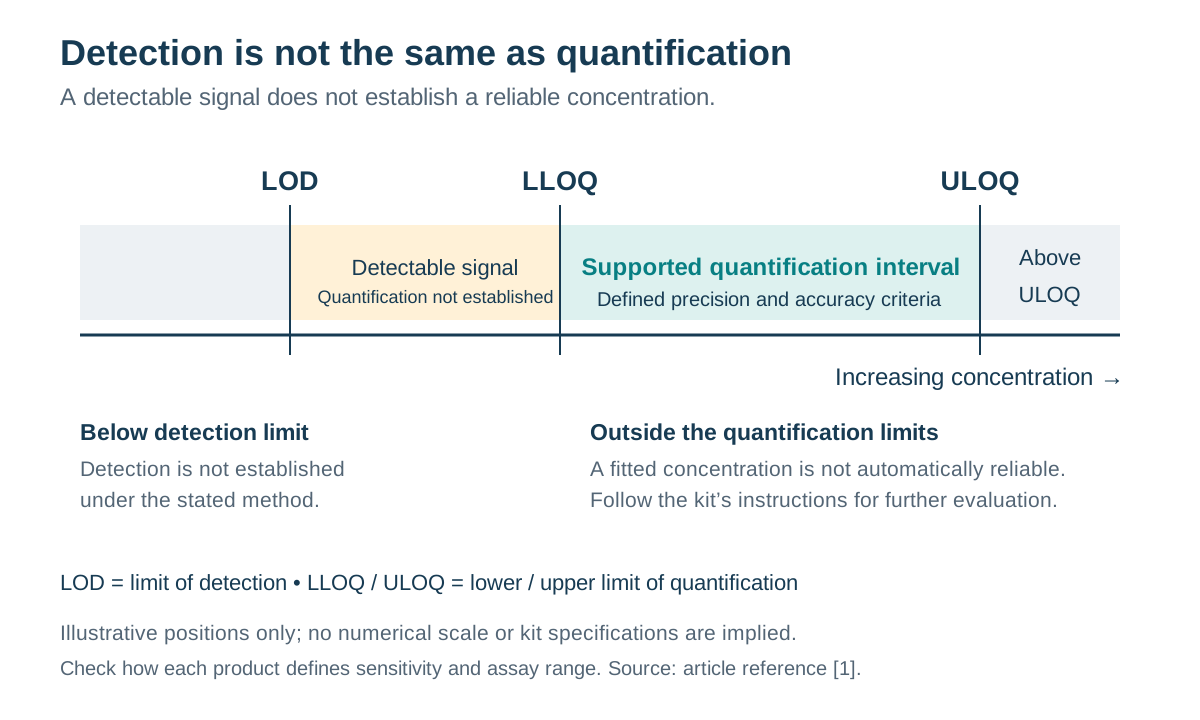
“Can this assay detect something?” and “Can it measure the concentration reliably?” are different questions. Product terminology can vary, so compare the definitions and evidence behind the figures. [1]
| Specification | Meaning for selection | Question to ask |
|---|---|---|
| Detection limit (LOD) | A detection threshold distinguished from background under the stated method. | How was it established, and under what conditions? |
| Lower limit of quantification (LLOQ) | The lowest concentration meeting defined quantitative performance criteria. | What precision and accuracy criteria were used? |
| Upper limit of quantification (ULOQ) | The highest concentration meeting those criteria. | How were high-concentration samples evaluated? |
| Stated assay range | The reported concentration interval; it may represent a calibration range, a demonstrated quantification range, or another interval. | Is it a calibration interval, a demonstrated quantification interval, or another stated range? |
Quantification limits define concentrations that can be measured with acceptable precision and accuracy. A detection limit describes a threshold distinguishable from background under specified conditions. If a kit reports “sensitivity,” check how that term is defined; do not assume it establishes reliable quantification. [1]
Convert values to consistent units: 1 ng/mL equals 1,000 pg/mL. Matching units makes numerical comparison possible, but does not prove that different kits measure identical molecular forms or use interchangeable calibrators.
Plan around the concentration after dilution. If a sample contains approximately 200 pg/mL and the total dilution factor is 4, the diluted sample contains approximately 50 pg/mL. Compare 50 pg/mL with the kit’s supported measurement interval. Conversely, an in-range result of 50 pg/mL corresponds to 200 pg/mL in the original sample when multiplied by that total factor.
This arithmetic does not establish that a fourfold dilution is appropriate. Confirm the diluent, permitted dilution and sample-specific dilution performance. A calculated value outside the supported interval should not be treated as reliable simply because curve-fitting software returns a number. [1]
Precision describes consistency of repeated measurements; accuracy concerns closeness to the true or accepted reference value. Consistent results can still be biased, so precision alone does not establish accuracy. [1]
Precision is often expressed as coefficient of variation: CV (%) = standard deviation ÷ mean × 100. Intra-assay results describe variability within a run; inter-assay results describe variability across runs under the study’s conditions. Compare the tested concentrations, sample matrices and experimental design—not only the headline CV. A low CV at one concentration cannot establish equally good precision near the lower limit. [1]
Ask whether the performance data match your intended use. What was tested: standards, spiked samples or naturally positive samples? Were the relevant matrices evaluated? Are specificity and dilution results available? Do storage data describe reagents or samples? Reagent shelf life does not establish how long your biological samples remain suitable. [1]
Avoid treating every numerical acceptance threshold published in a guide as a universal rule. Review the criteria appropriate to the selected assay and study, and document unresolved questions.
A plate’s well count is not its sample capacity. Standards, blanks, controls, replicates and pilot dilutions all consume wells. Thirty samples in duplicate use 60 wells before these additional allocations. Build the plate map using the selected kit’s instructions; do not assume all kits use the same number of standards.
Check sample volume per well and the total volume needed for replicates and possible repeats. Confirm included reagents, additional materials, equipment, incubation schedule, storage, expiration and ordering lead time. Compare kits on the complete experiment they enable, including controls and pilot work, rather than on kit price or well count alone.
Suppose you want to measure a target in 30 human serum samples. Preliminary information suggests original-sample concentrations of 100–800 pg/mL. For this teaching example only, assume both kits’ instructions permit a fourfold dilution and their fictional documentation reports the specifications below. The kit with the lower detection limit will turn out to be the weaker fit for the low-concentration samples at this dilution.
| Selection factor | Hypothetical Kit A | Hypothetical Kit B |
|---|---|---|
| Target and species | Intended target, human | Intended target, human |
| Supported sample | Human serum | Human serum |
| Detection limit | 2 pg/mL | 10 pg/mL |
| Demonstrated quantification interval under stated conditions | 50–1,000 pg/mL | 20–500 pg/mL |
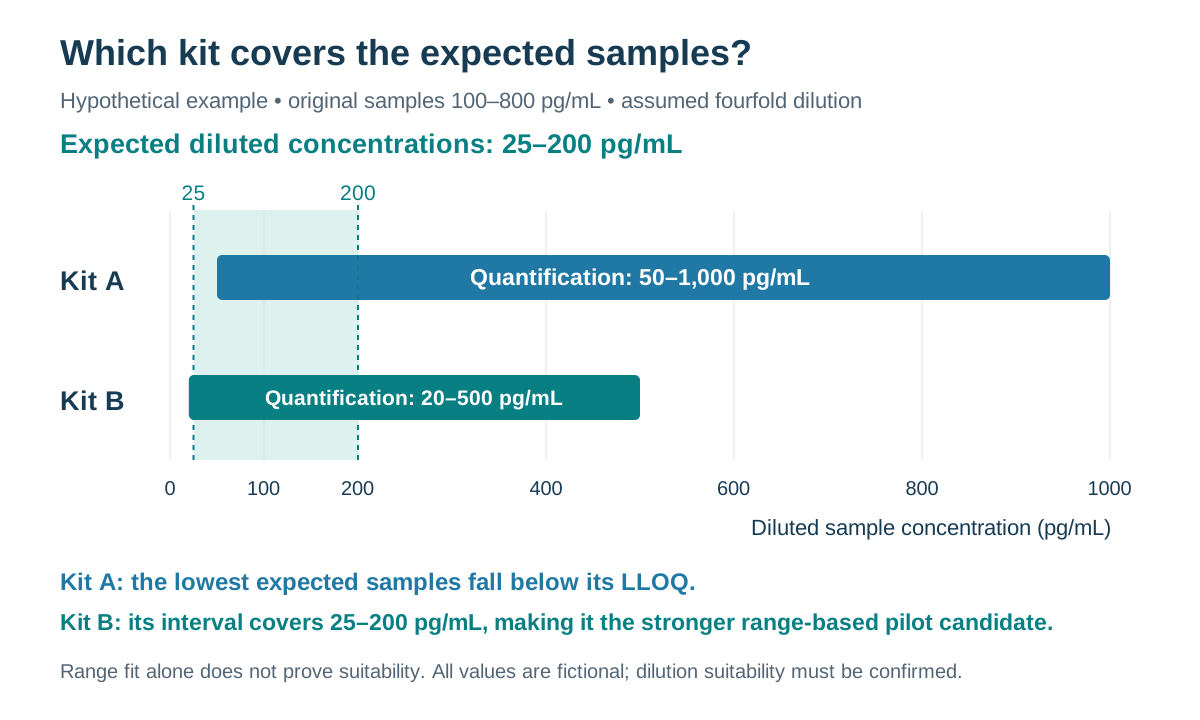
At fourfold dilution, 100–800 pg/mL becomes 25–200 pg/mL. Kit A has the lower detection limit, but the low end of the expected samples falls below its LLOQ. Kit B’s interval covers the expected diluted concentrations. On this criterion, Kit B is the stronger candidate for a pilot.
Multiplying the reported intervals by four gives nominal original-sample equivalents of 200–4,000 pg/mL for A and 80–2,000 pg/mL for B. These are arithmetic translations, not newly established validation ranges.
Before choosing B, compare specificity evidence and serum recovery/dilution data, check the sample-volume requirement, and reserve wells for standards and controls. If the actual concentrations differ from the estimate, reassess the dilution or kit choice using the instructions. A suitable range is one selection criterion, not proof of overall suitability.
All kit names, specifications and concentrations in this example are fictional and do not describe an actual product.
Not necessarily. A suitable kit must recognize your intended target, support your sample type and provide reliable quantification at the concentrations you expect after dilution. The worked example shows why a lower detection limit can still be a poorer fit for a study.
The limit of detection (LOD) describes a threshold distinguishable from background under specified conditions. The lower limit of quantification (LLOQ) is the lowest concentration meeting defined quantitative performance criteria. Detection alone does not establish reliable quantification. [1]
Do not assume compatibility, even after dilution. Request evidence for your sample preparation and plan a small pilot before committing a large sample set. Follow the selected kit’s instructions; evaluation of one kit or matrix does not establish compatibility for another. [1], [4]
There is no universal sample count. Standards, blanks, controls, replicates and pilot dilutions also need wells. Thirty samples measured in duplicate occupy 60 wells before these additional allocations; prepare a plate layout using the selected kit’s instructions.
Explore ADMEbio’s ELISA kit catalog to find options for your research. Use this checklist to review each kit’s catalog number, target, species, supported sample types and measurement range. Check the current product documentation before ordering.
Need help choosing an ADMEbio ELISA kit? Share your target, species, sample type, expected concentration if known, and sample count with ADMEbio. If you already have an ADMEbio catalog number, include it so we can help you review the relevant product documentation.