Hello, Sign in
My Account
My Account
New customer? Start here
A lower detection limit does not automatically make an ELISA kit a better choice. Match the concentrations you expect after sample dilution to the assay’s supported quantification interval, then check the evidence for your sample type. A detectable signal and a reliable concentration result answer different questions. [1,2]
This article explains how to read sensitivity and range specifications, calculate the effect of dilution, and handle results near the measurement limits. For the broader selection checklist, read How to Choose the Right ELISA Kit for Your Research.
This guide concerns research measurement planning and does not establish suitability for clinical diagnosis.
| Term | What to establish before comparing kits |
|---|---|
| Sensitivity | The definition of “sensitivity” can vary across ELISA product documentation; check what was measured and how the value was calculated rather than assuming it means LOD, LLOQ, or the lowest calibrator. Analytical sensitivity and functional sensitivity also have distinct technical meanings; using analytical sensitivity as a synonym for LOD is discouraged. [2] |
| Limit of detection or LOD | The lowest concentration reliably distinguished from the response of a blank sample under specified conditions. It does not by itself establish quantitative performance. [2] |
| Lower and upper limits of quantification | LLOQ and ULOQ bound concentrations meeting stated precision and accuracy criteria. [1] |
| Calibration range | The concentrations used to construct the standard curve. Ask which portion supports quantitative results. |
| Detection range or assay range | Read the product’s definition. Determine whether it describes calibration, quantification or another interval. |
A specification such as “sensitivity 2 pg/mL” is incomplete for selection without its definition and supporting conditions. Ask whether it is a detection estimate from blanks or a concentration assessed for quantitative performance. Also ask what sample matrix and preparation were evaluated. [1,2]
LOD and LLOQ describe different performance requirements, even when their numerical values coincide. The lower quantification limit is typically higher than the detection limit, and how much higher depends on the bias and imprecision criteria used to define it. A detection claim alone still does not establish quantitative performance. [2]
One reason these terms should not be used interchangeably is that a detection limit can fall below the range over which the calibration curve is valid, so a figure quoted as a detection capability may sit outside the interval that supports a quantitative result. [2]
The lowest standard is a calibration point; its presence alone is not evidence that unknown samples at that concentration meet acceptable precision and accuracy. A fitted curve can produce a number without establishing that the number is reliable. [1]
Use the total dilution factor from every preparation step that dilutes the sample. For dilution alone, concentration in the measured sample equals original concentration divided by the total factor. Multiply an acceptable measured result by that factor to express the concentration in the original sample. Confirm the kit’s actual procedure and dilution performance. [1]
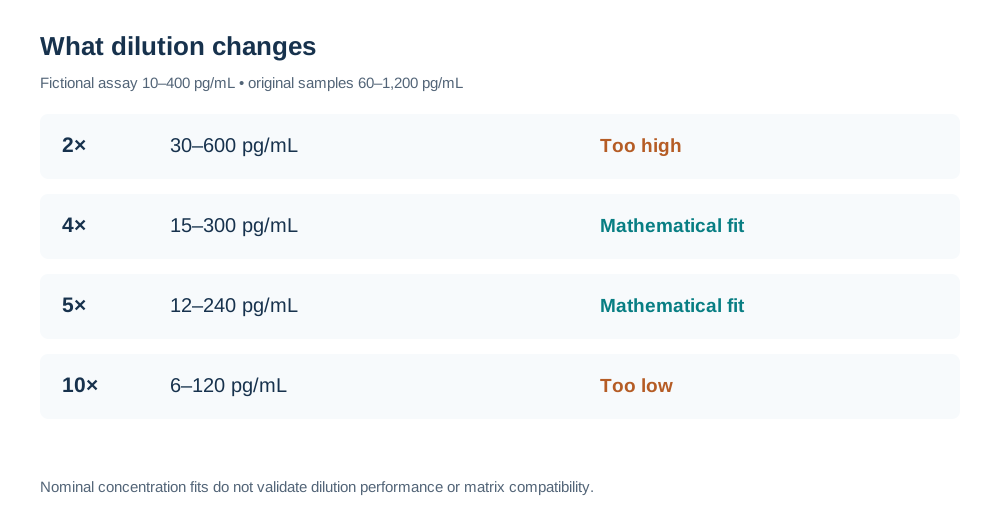
Hypothetical example: a different fictional assay from Article 01 has a demonstrated quantification interval of 10–400 pg/mL. The original samples are expected to span 60–1,200 pg/mL. The table compares possible total dilution factors; none is a recommendation for a real kit.
| Total factor | Expected measured samples | Nominal original interval | Range comparison |
|---|---|---|---|
| 2 | 30–600 pg/mL | 20–800 pg/mL | High samples exceed 400. |
| 5 | 12–240 pg/mL | 50–2,000 pg/mL | Expected interval fits. |
| 10 | 6–120 pg/mL | 100–4,000 pg/mL | Low samples fall below 10. |
The fivefold dilution fits this fictional interval. It remains only a candidate for a pilot: preparation, permitted dilution, matrix compatibility and dilution behavior must also be acceptable. Multiplying limits gives nominal original-sample equivalents, not newly validated ranges. [1]
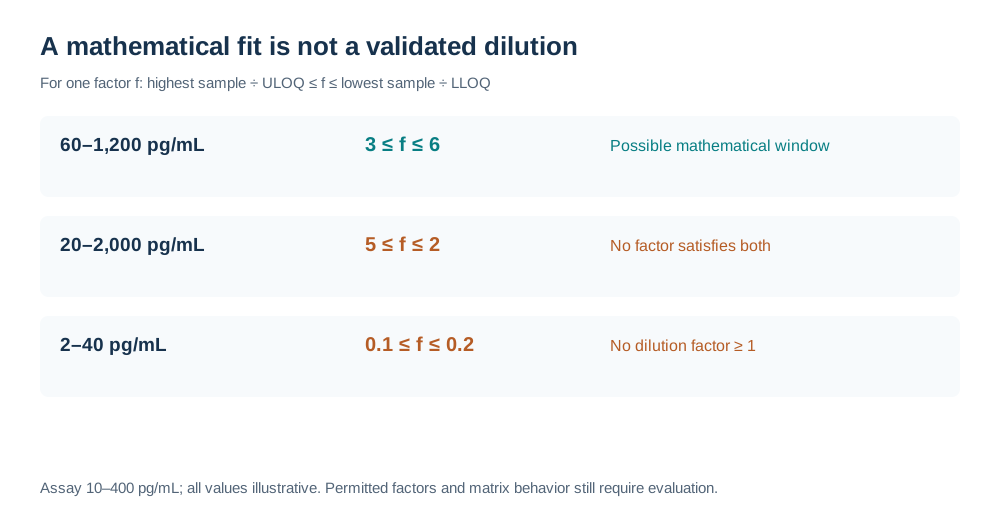
For the same fictional 10–400 pg/mL assay, suppose original samples instead span 20–2,000 pg/mL. To retain the lowest sample at or above 10, the dilution factor must be no greater than 2. To bring the highest sample down to 400 or below, it must be at least 5. No single factor satisfies both conditions.
This arithmetic exposes a planning problem before you commit the full sample set. Consider separately evaluated dilutions for different concentration groups, or an assay with an appropriate supported interval. Reserve sample volume and wells for the pilot and possible repeat measurements. Any approach still needs evidence for the selected preparation.
Notice what dilution changes: it lowers the concentration presented to the assay. It can bring high samples into range while moving low samples below the LLOQ. It does not automatically improve low-concentration quantification.
Compare fold spans: divide the highest original concentration by the lowest, and divide ULOQ by LLOQ. When the lowest expected concentration and the LLOQ are both above zero and dilution alone is considered, the sample fold span must not exceed the assay fold span for one dilution to fit. This is a necessary arithmetic check; permitted dilution factors and matrix performance can still rule a candidate out.
The 20–2,000 pg/mL samples span 100-fold; the 10–400 pg/mL interval spans 40-fold. No single dilution fits. The earlier 60–1,200 pg/mL samples span 20-fold, so they pass this check.
For that earlier example, bring the highest sample into range by requiring a factor of at least 1,200 ÷ 400 = 3. Retain the lowest sample by requiring a factor no greater than 60 ÷ 10 = 6. Any factor from 3 to 6, inclusive, fits mathematically; factor 4 gives 15–300 pg/mL. These are possible range fits, not validated procedures. For dilution alone, factors must also be at least 1 and comply with the selected kit’s instructions.
The fold-span check can also pass while no usable dilution exists. For example, original samples of 2–40 pg/mL span 20-fold against the same 40-fold assay interval, but their mathematical factor window is 0.1–0.2. Every factor in that window is below 1, which would require concentration rather than dilution. Even undiluted, the lowest samples fall below the LLOQ. Confirm that the acceptable factor window contains at least one factor of 1 or greater; a concentration step, if considered, needs its own evidence of suitability.
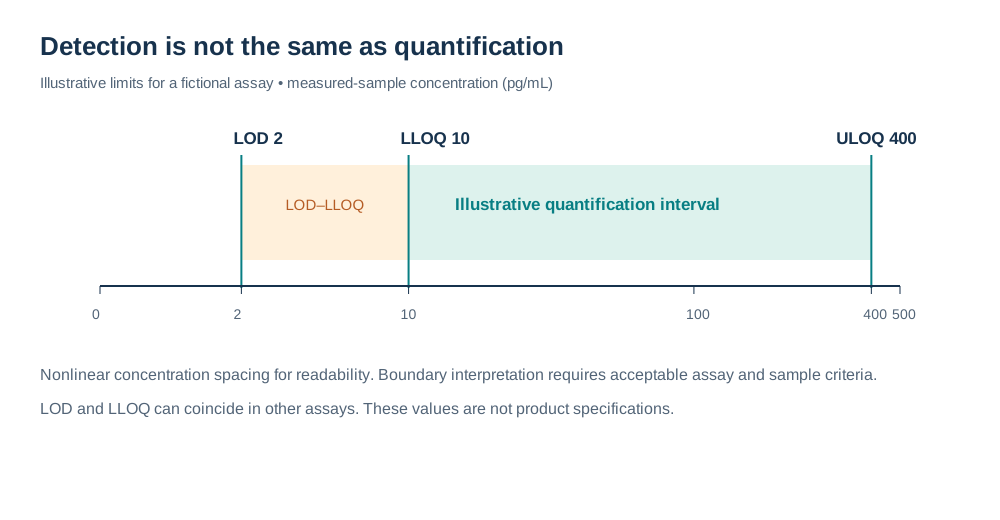
Hypothetical reporting example: LOD 2 pg/mL, LLOQ 10 pg/mL and ULOQ 400 pg/mL. The gap between LOD and LLOQ is part of this example, not a requirement for every assay. The categories below concern the measured, diluted sample. Use your laboratory’s predefined reporting rules and the selected assay documentation; these are educational examples, not universal reporting labels. [1,2]
| Result region | Interpretation and next step |
|---|---|
| Below the detection limit | Detection is not established by this method. A low signal does not demonstrate an original concentration of zero. |
| Detectable but below 10 pg/mL | Do not present an exact concentration as validated quantification. Record the limit and consider an appropriate repeat or alternate method. |
| 10–400 pg/mL | Eligible for quantitative interpretation only if calibration, controls, sample compatibility and run criteria are acceptable. |
| Above 400 pg/mL | Do not extrapolate an exact result beyond the supported interval. Evaluate a permitted further dilution and repeat. |
Multiplying an unreliable below-LLOQ estimate by a dilution factor does not make it reliable. Keep the measured-sample limits and the total dilution factor in the result record so readers can understand any original-sample limit you report.
Precision varies with concentration. In a competitive ELISA study, researchers modeled concentration-dependent imprecision and used it to define a quantification region. The finding illustrates why precision should be examined across a range rather than reduced to one headline value; the study’s numerical criteria are not universal requirements for research kits. [3]
Illustrative calculation: repeated concentration estimates have mean 12 pg/mL and standard deviation 3 pg/mL. CV = 3 ÷ 12 × 100 = 25%. At another level, mean 120 pg/mL and standard deviation 6 pg/mL give CV = 5%. These fictional results show that an assay can behave differently near its lower end. Neither percentage is an automatic pass or fail: decide the criteria appropriate to the study and examine accuracy as well. [1]
When small biological differences matter, ask for precision data near those expected concentrations. Do not treat analytical detection capability as proof that the assay can resolve the difference your experiment is designed to study.
Only if the documentation explicitly defines and supports it that way. A detection-limit figure alone does not establish reliable quantification. [2]
Compare the definitions and supporting data first. A wide reported interval is useful only if it supports your sample concentrations and intended measurement.
Dilution lowers sample concentration. In the fictional example, a fivefold factor makes a 10 pg/mL measured-sample LLOQ equivalent to 50 pg/mL in the original sample, subject to acceptable dilution performance.
A result below the quantification limit does not establish zero analyte. Define how limited results will be recorded before analyzing the study. [2]
Explore ADMEbio’s ELISA kit catalog and compare each candidate’s stated specifications, assay range and sample requirements with your study needs. Use available supporting documentation to check how expected concentrations after dilution relate to the supported quantification interval. If a specification’s definition or supporting data are not provided or accessible, contact ADMEbio to request clarification before ordering. Share your target, species, sample type, expected concentrations and preparation steps so we can help you review the relevant product documentation.