Hello, Sign in
My Account
My Account
New customer? Start here



| Catalog # | Availability | Size | Quantity | Unit Price | Save For Later Wish List | |
|---|---|---|---|---|---|---|
| EKEL20168MU-96 | 2 weeks | 96T | $575.00 |
Select product before adding to cart
|
||
| EKEL20168MU-48 | 2 weeks | 48T | $400.00 | |||
| EKEL20168MU-96x5 | 2 weeks | 96T*5 | $2,435.00 |
Product Overview | ||||||||||||||||||||||||||||
| Name | Mouse CD99(Cluster Of Differentiation 99) Microsample ELISA Kit | |||||||||||||||||||||||||||
|---|---|---|---|---|---|---|---|---|---|---|---|---|---|---|---|---|---|---|---|---|---|---|---|---|---|---|---|---|
| Accession (Primary) | Q8VCN6 | |||||||||||||||||||||||||||
| Reaction Duration | 3.5h | |||||||||||||||||||||||||||
| Target Species | Mouse | |||||||||||||||||||||||||||
| Reactivity | Mouse | |||||||||||||||||||||||||||
| Sensitivity | 0.068 ng/mL | |||||||||||||||||||||||||||
| Assay Range | 0.16-10 ng/mL | |||||||||||||||||||||||||||
| Assay type | Sandwich | |||||||||||||||||||||||||||
| Sample type(s) | Serum, plasma, tissue homogenates, cell lysates, cell culture supernates and other biological fluids | |||||||||||||||||||||||||||
| Other Names | ||||||||||||||||||||||||||||
| MIC2X; MIC2Y; MIC2; Antigen Identified By Monoclonal Antibodies 12E7, F21 And O13; E2 antigen; T-cell surface glycoprotein E2 | ||||||||||||||||||||||||||||
| Principle of the Assay | ||||||||||||||||||||||||||||
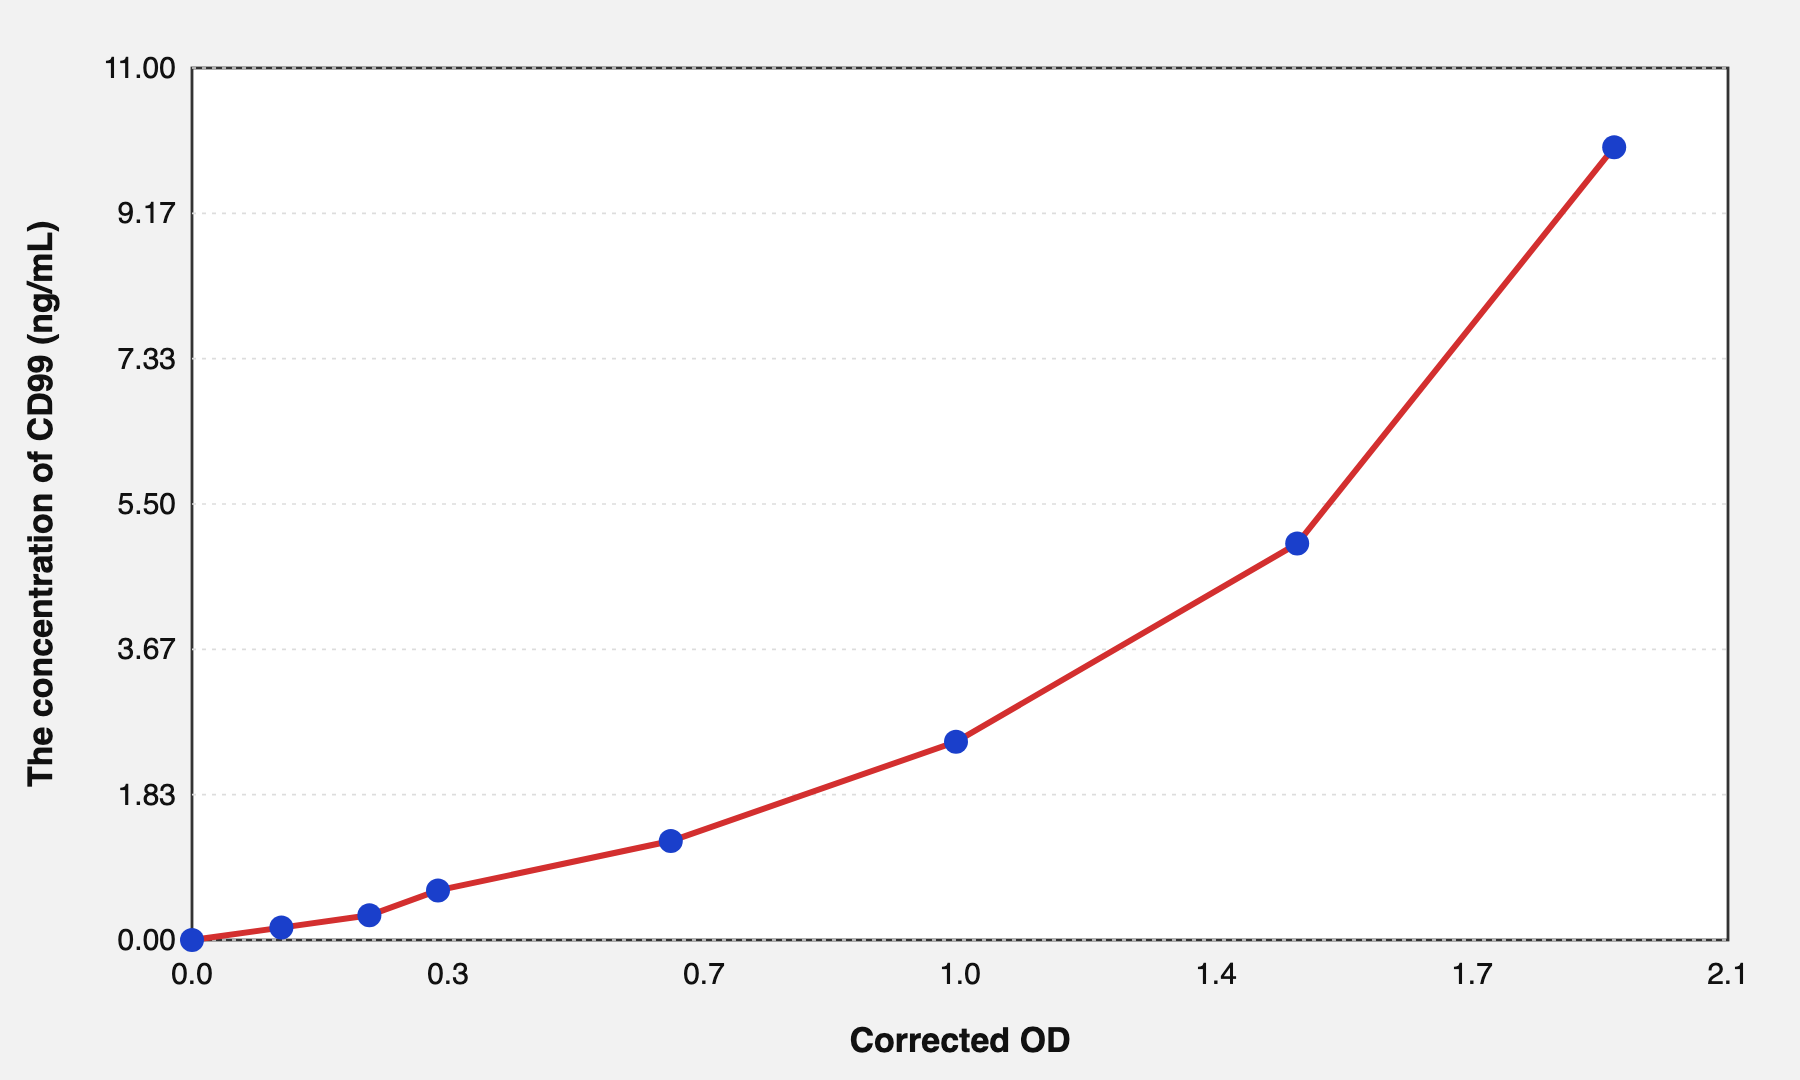
| The test principle applied in this kit is Sandwich enzyme immunoassay. The microtiter plate provided in this kit has been pre-coated with an antibody specific to Mouse CD99. Standards or samples are added to the appropriate microtiter plate wells then with a biotin-conjugated antibody specific to Mouse CD99. Next, Avidin conjugated to Horseradish Peroxidase (HRP) is added to each microplate well and incubated. After TMB substrate solution is added, only those wells that contain Mouse CD99, biotin-conjugated antibody and enzyme-conjugated Avidin will exhibit a change in color. The enzyme-substrate reaction is terminated by the addition of sulphuric acid solution and the color change is measured spectrophotometrically at a wavelength of 450nm ± 10nm. The concentration of Mouse CD99 in the samples is then determined by comparing the OD of the samples to the standard curve. | ||||||||||||||||||||||||||||
| Standard Curve | ||||||||||||||||||||||||||||
 | ||||||||||||||||||||||||||||
| Precision | ||||||||||||||||||||||||||||
| ||||||||||||||||||||||||||||
| Recovery | ||||||||||||||||||||||||||||
Matrices listed below were spiked with certain level of recombinant CD99 and the recovery rates were calculated by comparing the measured value to the expected amount of CD99 in samples.
| ||||||||||||||||||||||||||||
Target Information: ( Q8VCN6 ) | ||||||||||||||||||||||||||||
| Name | CD99 | |||||||||||||||||||||||||||

Thousands of laboratories across the world have published research that depended on the performance of antibodies from ADMEbio to advance their research.
Check out links to articles that cite our products in major peer-reviewed journals, organized by research category.
Thank you,
ADMEbio Team


ADMEbio welcomes feedback from our customers.
Thank you,
ADMEbio Team