Hello, Sign in
My Account
My Account
New customer? Start here
An unexpected ELISA result is a symptom, not a diagnosis. High background, weak signal, inconsistent replicates, and poor standard curves can have several causes. The most useful first step is to identify whether the problem affects blanks, standards, controls, unknown samples, or the entire plate—and compare the pattern with the selected kit’s instructions.
Quick answer — High background: compare blanks, controls and the selected kit’s washing, blocking and reagent instructions. Weak signal: examine standards, controls, reagent handling, instrument settings and sample compatibility. Variable results: inspect raw replicates, pipetting, mixing, timing and plate-position patterns. An unexpectedly low result in a sample believed to contain abundant analyte warrants review of matrix effects and, in susceptible two-site assays, possible high-dose hook effects. These are diagnostic starting points, not confirmed causes.
This guide covers research-use troubleshooting principles, not universal reagent concentrations, incubation times, washing cycles, acceptance cutoffs, or instructions for clinical diagnosis. Record what happened before changing one variable at a time.
Compare the same run’s blank, calibration standards, controls and unknown samples. A plate-wide problem suggests a different starting point from a problem limited to one sample or to edge wells. A failed control can invalidate interpretation even when a fitted standard curve looks smooth. Calibration and control principles are discussed in references [1,2]; operational checks should follow the selected kit’s instructions.
| Observed pattern | Possible contributors | First check |
|---|---|---|
| Blank and low standards are high | Incomplete washing, reagent contamination, nonspecific binding, substrate exposure | Compare blank behavior, wash steps, reagent preparation and incubation timing. |
| All wells, including standards, are weak | Reagent activity, incorrect sequence, detector settings, expired or improperly stored components | Confirm the kit protocol, reader wavelength/settings, controls and reagent handling. |
| Standards acceptable; unknowns inconsistent | Sample matrix, mixing, dilution, sample stability or analyte heterogeneity | Review sample preparation, dilution records and matrix-specific evidence. |
| Only edge wells differ | Temperature gradients, evaporation, uneven incubation or sealing | Review plate placement, sealing and timing; do not infer a cause from position alone. |
| Replicates disagree across the plate | Pipetting, bubbles, inadequate mixing, timing differences | Inspect raw well values, pipette technique, bubbles and processing sequence. |
| One unknown sample is implausibly low despite an expectation of high analyte | Possible high-dose hook effect in a susceptible two-site assay, matrix interference, degradation, handling error or other assay-specific factors | Check assay configuration, sample history, standards and controls; consider only kit-permitted dilution and repeat testing [3]. |
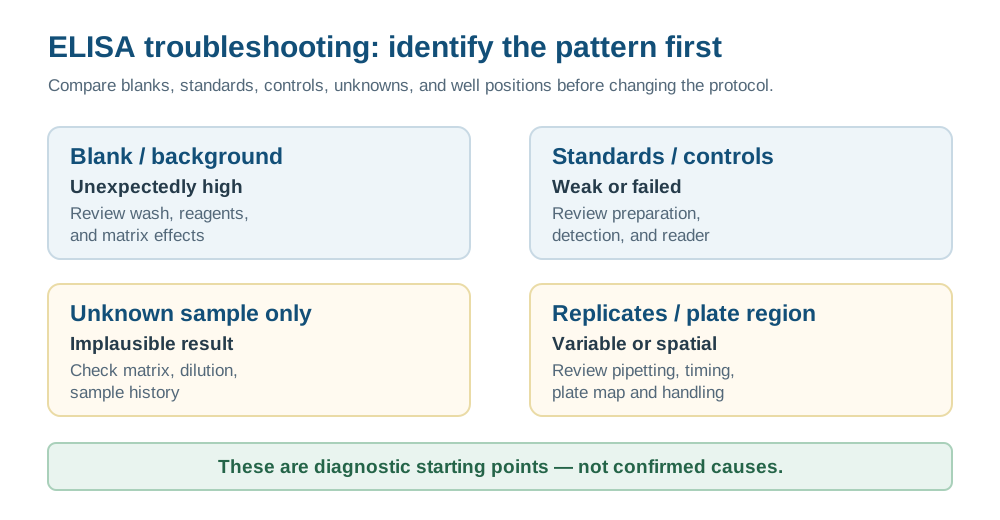
High background reduces the contrast between low-concentration samples and the assay blank and may compromise interpretation near the lower measurement limit. Possible contributors to investigate include incomplete removal of unbound material, nonspecific binding, reagent contamination, substrate contamination or prolonged substrate development in applicable detection systems, incubation conditions and sample-specific interference. These are practical hypotheses to check against the kit’s Troubleshooting and Precautions for Kits instructions where available; immunoassay-specific interference mechanisms are reviewed in reference [3].
Check how the selected kit defines its blank and negative controls. Confirm its prescribed wash procedure and whether reagents were prepared, stored and used as instructed. Examine whether background affects the whole plate or particular sample types. Do not automatically increase washing or change blocking reagents: an unverified modification can also reduce the desired signal. The kit protocol, not references [1–3], is the source for operational wash and incubation settings.
A weak signal may reflect low analyte concentration, but it can also arise from reagent or instrument problems, sample-matrix interference, unsuitable dilution or a mismatch between analyte form and assay recognition. Review standards and controls first: if they are also weak, investigate run-wide handling and detection conditions before interpreting sample biology. Matrix and antibody interference are documented in reference [3]; instrument and handling checks are kit-specific diagnostic considerations.
Confirm the specified detection chemistry, plate-reader settings, incubation sequence, reagent storage and expiration conditions, and any minimum required dilution in the kit instructions. A low signal should not automatically be reported as zero; see ELISA Sensitivity vs. Detection Range, for detection versus quantification limits. If standards pass but unknown samples remain weak, review the supported matrix, possible degradation or analyte sequestration, and whether the sample lies below the assay’s supported quantification interval. Interference can be sample-specific [3].
Replicate variability can arise from inconsistent liquid delivery, mixing, bubbles, incubation timing or sample heterogeneity. Position-related patterns may be consistent with evaporation or temperature gradients, but location alone cannot establish a mechanism. These are practical laboratory checks, not effects established by the validation paper [1].
Inspect raw well readings before averaging. Review the plate map, pipette technique, dispensing order, mixing, seals and incubation records using the selected kit’s instructions. Compare within-run controls and predefined repeat criteria. Do not impose a universal coefficient-of-variation (CV) threshold across kits or concentration levels: assay imprecision must be evaluated for the intended measurement range [1].
A smooth fitted curve does not demonstrate that standards, controls or unknowns were measured reliably. If the curve behaves unexpectedly, review standard preparation and dilution records, well assignments, reader settings and the fitting approach specified by the kit. Examine calibrator back-calculation and controls where the method supports them [1,2].
Many immunoassays use 4PL or 5PL calibration, but neither model is automatically superior and an R² value alone is not a run-acceptance decision. Do not switch models merely to improve the appearance of a failed run. Understanding ELISA Standard Curves and Results explains interpolation, quantification limits and why software may return a number outside the supported interval.
If a sample changes disproportionately after dilution, consider matrix interference, analyte forms, binding proteins and dilution suitability. Heterophilic antibodies, rheumatoid factor and other interfering substances can affect immunoassay measurements [3]. A dilution series that fails to recover the expected concentration relative to a calibrator may suggest antibody interference, but does not establish the cause [3]. Dilution reduces both analyte and some interferents; it does not automatically correct interference or validate a result. Follow any kit-defined minimum required dilution [2]. Spike recovery, dilutional linearity, and parallelism are distinct evaluation concepts [1]; see Preparing Samples for ELISA for further explanation.
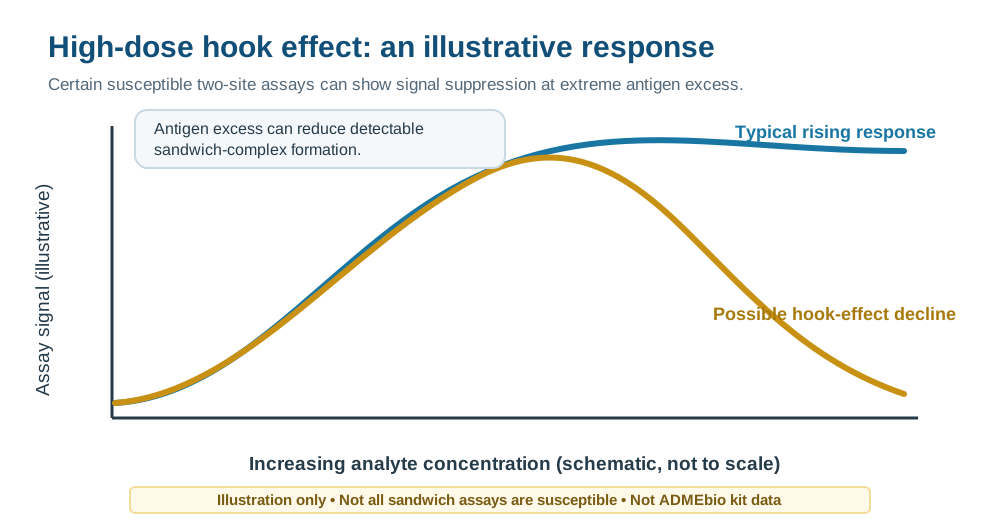
In susceptible two-site immunoassays, particularly designs where capture and detection antibodies encounter the sample simultaneously, very high analyte concentrations can cause antigen excess, disrupting formation of the detectable antibody–analyte–antibody complex and producing a falsely low signal (high-dose hook effect) [3]. Tate and Ward describe a published prolactin case in which a result of 1,500 mU/L rose to 950,000 mU/L after reassessment using sample dilutions [3]; this is a case illustration, not an expected effect size for ELISA kits. This is format- and procedure-dependent: not every sandwich assay is susceptible, and an unexpectedly low result does not prove a hook effect. If clinically or biologically implausible, check the kit’s specific instructions and evaluate a permitted, controlled dilution and repeat measurement rather than improvising a correction [1,3]. Unexpected dilution behavior is an investigative clue, not definitive confirmation of a hook effect or its cause [3]. For binding-format fundamentals, see Sandwich vs. Competitive ELISA: Which Do You Need?
Possible causes include incomplete washing, nonspecific binding, reagent contamination, or sample interference. Compare blanks, controls, and affected wells before changing the kit procedure.
Standards and samples can differ in matrix, analyte form, stability, and dilution. Check sample compatibility and whether the measured concentration is within the supported interval; a good standard curve does not prove sample suitability.
Pipetting differences, bubbles, mixing, timing, and sample heterogeneity are possible contributors. Inspect raw readings and the plate map; use assay- and concentration-appropriate criteria rather than a universal CV cutoff.
Yes. Some two-site immunoassays can show a high-dose hook effect when extreme analyte concentrations disrupt formation of the detectable complex [3]. It is not universal; assess implausibly low readings with the selected kit’s supported dilution and repeat procedure.
Not automatically. First check standard preparation, control performance, reader settings, and the assay’s prescribed model. Extra fitting flexibility does not demonstrate reliable quantification.
No. Multiplying an unreliable measured-sample estimate by a dilution factor does not make it validated quantification. Use the assay’s supported reporting rules.
Explore ADMEbio’s ELISA kit catalog and compare each candidate’s sample type, assay format, dilution guidance, calculation instructions and available supporting documentation. Product pages may also contain Troubleshooting and Precautions for Kits sections; availability and detail vary by kit. If a procedure or performance claim is unclear, contact ADMEbio with target, species, sample matrix, expected concentration, kit lot/batch number, plate map, raw readings and control observations. Retain used strips or remaining materials if support requests them and they can be handled safely.