Hello, Sign in
My Account
My Account
New customer? Start here
Good ELISA results begin before a sample reaches the plate. Collection tubes, processing delays, sample matrix, storage, and dilution can affect what an assay measures. This guide explains how to plan sample preparation without treating one protocol as appropriate for every analyte or kit.
Quick answer — Follow the selected kit’s instructions for supported sample types, collection, processing, storage, and dilution. Keep handling consistent across comparison groups, remove interfering particulates when appropriate, and verify that diluted samples behave acceptably in the assay. An ELISA format or stated assay range alone does not establish that a particular sample preparation is suitable. [1,2]
Research-use planning only. This guide does not establish clinical diagnostic suitability or replace a kit-specific protocol.
Serum, plasma, cell culture supernatant, urine, and tissue or cell lysates differ in proteins, salts, lipids, detergents, and other constituents. An analyte may occur in free, bound, processed, or complexed forms. Before collection, confirm that the selected assay supports the intended matrix and analyte form; ask whether compatibility is supported by validation, other testing, or manufacturer experience. [2,3]
| Sample type | Preparation questions to resolve |
|---|---|
| Serum | Serum is collected after clotting; ask how clot formation and separation timing might affect the analyte. [3] |
| Plasma | Plasma uses an anticoagulant; verify whether EDTA, heparin, citrate, or the chosen additive was evaluated. [2,3] |
| Cell culture supernatant | Culture medium and supplements may influence assay response; check compatibility and how cell debris is removed. |
| Urine | Urine composition and pH may vary; consider collection, dilution, and any study-specific normalization plan. |
| Cell or tissue lysate | Lysis buffer, detergents, inhibitors, and particulates can affect detection; check compatibility and clarification needs. |
These are preparation questions, not universal instructions. Acceptance of “plasma” does not establish compatibility with every anticoagulant. [2,3] For general kit selection, see How to Choose the Right ELISA Kit for Your Research.
Plan and document collection and processing before starting a study. Tube additives, elapsed time, temperature, mixing, and separation can introduce preanalytical variation unrelated to the biological question. Follow kit-specific processing instructions where provided; do not substitute generic centrifugation settings without justification. [3]
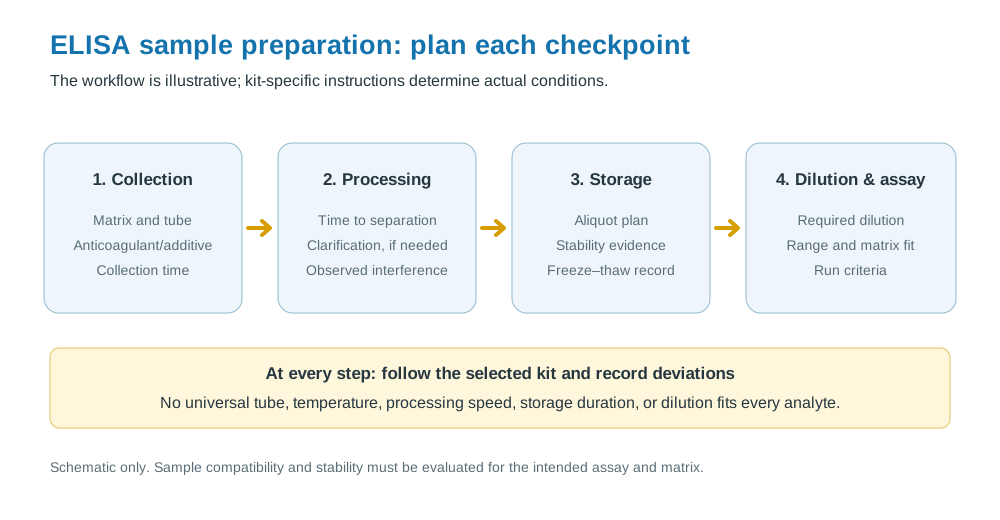
Storage stability depends on the analyte and matrix. Refrigeration, freezing, bench time, and repeated freeze–thaw cycles can change measured concentrations or introduce variability. There is no universal storage temperature, duration, or safe freeze–thaw count for every ELISA target. Follow applicable kit guidance and seek analyte- and matrix-specific stability evidence where available. [1,3]
When feasible, aliquot samples to avoid unnecessary thawing and refreezing; keep study groups on comparable handling schedules and record deviations. General storage recommendations on a product page are not necessarily demonstrated stability data for the particular analyte and matrix. If evidence is unavailable, document the assumptions and interpret results with that uncertainty. [3]
A matrix effect occurs when sample constituents alter the relationship between analyte concentration and assay response relative to the calibration environment, potentially affecting recovery, antibody binding, detection, or signal generation. Examples include heterophilic antibodies, rheumatoid factor, analyte-binding proteins, lipids, and some detergents. Documentation may discuss related concerns under “specificity,” “selectivity,” or “interference.” Performance in assay buffer does not automatically establish performance in serum, plasma, or lysate. [2]
A result numerically inside the reported assay range is not automatically accurate in that matrix. Check the tested matrices, additives, and sample requirements in the kit documentation. Poor recovery, high background, or unexpected dilution behavior can signal interference, but no single observation identifies its cause. [1,2]
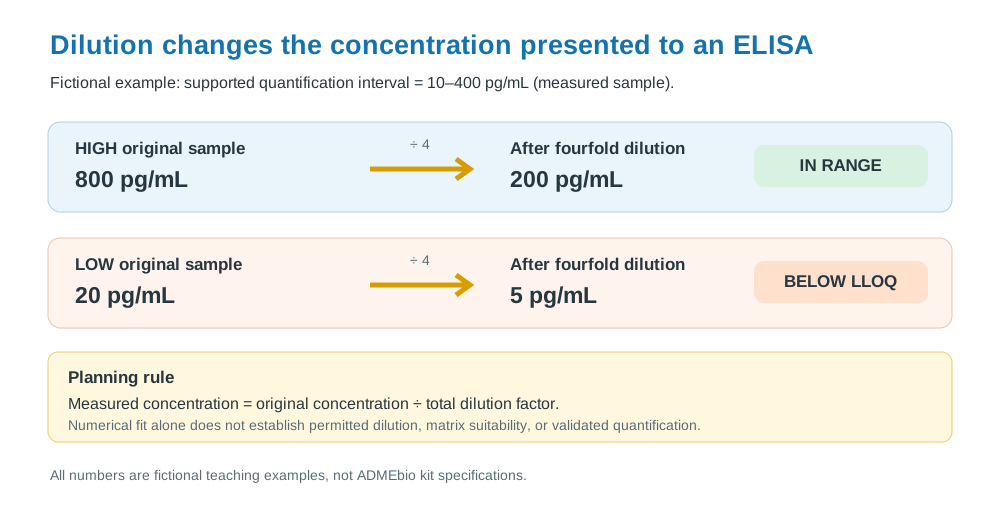
Dilution can bring a high-concentration sample into an assay’s supported interval and sometimes reduce matrix interference. It also reduces the concentration of analyte entering the assay and may move a low sample below the quantification limit; additional dilution cannot rescue a low-concentration sample. [1]
Some ligand-binding assays specify a minimum required dilution (MRD) to reduce background or matrix interference. In the method described by ICH M10, this dilution is established during method development and applies consistently to samples, calibrators, and quality controls. Follow the selected kit’s required dilution rather than assuming any additional dilution is acceptable. A method-defined MRD is different from an extra dilution chosen to bring an unknown sample into range. [2]
For dilution alone, measured-sample concentration = original concentration ÷ total dilution factor. An acceptable measured result can be converted to an original-sample equivalent by multiplying by the total factor. These calculations do not by themselves validate the dilution procedure.
| Illustrative case — fictional concentrations | Calculation | Planning implication |
|---|---|---|
| Original sample 800 pg/mL (above 400 ULOQ); factor 4 | 800 ÷ 4 = 200 pg/mL | 200 pg/mL falls inside the hypothetical 10–400 pg/mL interval, if the dilution is permitted and matrix-suitable. |
| Original sample 20 pg/mL; factor 4 | 20 ÷ 4 = 5 pg/mL | 5 pg/mL is below the hypothetical 10 pg/mL LLOQ; extra dilution worsens low-end fit. |
| Two sequential twofold dilutions (1-in-2; one volume sample plus one volume diluent each step) | 2 × 2 = total factor 4 | Record the total factor and each preparation step. |
All values in this table are fictional teaching examples, not ADMEbio kit specifications. For a full dilution-window explanation, see ELISA Sensitivity vs. Detection Range: What Matters?
Depending on the study, a pilot may examine recovery, dilutional linearity, and parallelism. These are related but different questions: [1,2]
| Evaluation | Question it addresses |
|---|---|
| Spike recovery | Can a known amount of analyte added to the sample matrix be recovered acceptably? [1] |
| Dilutional linearity | For a sample spiked above the upper quantification limit and diluted into the working range, do dilution-corrected concentrations remain acceptably consistent? Inspect unexpected signal suppression at very high concentrations, which may reflect a high-dose hook effect in susceptible assays. Detailed troubleshooting belongs elsewhere. [1,2] |
| Parallelism | For unspiked samples with endogenous analyte high enough to evaluate but below the upper quantification limit, does the dilution-response pattern resemble the calibrator’s within assay-appropriate criteria? This examines whether endogenous analyte behaves similarly in antibody binding. Spiking answers a different question; numerical consistency alone does not prove parallelism. [1,2] |
Spike recovery does not establish parallelism, and dilutional linearity is not a synonym for parallelism. Choose evaluation criteria appropriate to the assay and intended use; no single CV or recovery cutoff applies to all research ELISAs. [1,2]
Not automatically. Clotting and anticoagulants can affect some analytes or assay responses. Confirm which matrices and additives were evaluated for the selected kit.
No universal processing step is appropriate for every matrix and analyte. Follow the selected assay’s instructions and consider whether the step could remove, alter, or redistribute the target.
Dilution may reduce some interferents but also lowers analyte concentration. Some methods specify a minimum required dilution to control background or interference; further dilution is not automatically beneficial or valid. Follow the selected assay’s instructions and evaluate the intended matrix. [2]
There is no universal safe number. Use analyte- and matrix-specific stability information, minimize unnecessary cycles, and document handling.
In the validation approach described by reference [1], dilutional linearity uses a sample spiked above the upper quantification limit and diluted into range to examine dilution-corrected consistency. Parallelism uses unspiked material containing high endogenous analyte (below the upper limit for the cited procedure) to assess whether its dilution response resembles the calibrator’s. Spiking would obscure that endogenous-analyte question. Read the test method, not just its label. [1,2]
Explore ADMEbio’s ELISA catalog and compare the stated sample requirements, assay range, and available supporting documentation. Product pages may include Sample type(s), Samples needed per well, Sample Collection and Storage, Notes for Samples, and Recommended Sample Dilution Ratio; availability and detail vary by kit. If matrix compatibility, dilution instructions, or analyte-specific stability evidence are missing or unclear, contact ADMEbio with your target, species, sample type, preparation plan, and expected concentrations before ordering.