Hello, Sign in
My Account
My Account
New customer? Start here
An ELISA standard curve converts an assay signal into an estimated concentration, but a numerical output is not automatically a reliable measurement. Interpret results using the kit’s calibration model, validated quantification interval, controls, sample dilution, and sample-matrix evidence. [1,2]
Quick answer — A trustworthy ELISA result requires more than a smooth-looking standard curve: standards and controls must behave acceptably, the unknown must lie within the supported quantification interval, and the sample’s dilution and matrix must be suitable. A concentration extrapolated beyond validated limits should not be reported as though it were measured reliably. [1,2]
This guide explains common curve shapes, 4PL/5PL fitting, interpolation, and practical result checks. It is for research-use assay interpretation, not clinical diagnosis or a universal validation protocol. For choosing a kit, see How to Choose the Right ELISA Kit for Your Research. For assay ranges and sample preparation, see ELISA Sensitivity vs. Detection Range and Preparing Samples for ELISA.
A standard curve relates known calibrator concentrations to measured assay responses, such as absorbance or another instrument readout. Unknown sample responses are interpolated against the curve to estimate concentrations; reliable interpretation also depends on whether the sample behaves comparably to the calibrators under the assay conditions. In a common sandwich ELISA, response generally rises with concentration; in many competitive ELISAs, response falls as concentration increases. Always use the response direction and calibration procedure specified for the selected kit. [1,2] For the binding-format distinction, see Sandwich vs. Competitive ELISA: Which Do You Need?
The plotted standards define calibration points, but their presence alone does not establish that unknown samples meet quantitative performance criteria throughout that interval. In the ICH M10 ligand-binding-assay framework, the LLOQ and ULOQ are the lowest and highest calibration standards of a method that meets defined acceptance criteria [2]. Research-use ELISA documentation may report a standard range without demonstrating comparable quantitative performance for unknowns. Check what evidence supports the stated limits.
| Term | What it tells you |
|---|---|
| Calibrator / standard | Known-concentration material used to establish the relationship between response and concentration. |
| Blank / zero calibrator | A matrix or reagent condition without added analyte; the exact role depends on the assay and fitting procedure. |
| Calibration range | The span covered by calibration standards. Under the ICH M10 ligand-binding framework, the LLOQ and ULOQ are the lowest and highest standards meeting the method’s defined criteria [2]; a research kit may list a range without publishing that evidence. |
| LLOQ and ULOQ | Lower and upper limits of the interval supported for quantitative interpretation under stated criteria. |
| Unknown sample | Specimen with an assay response that is interpreted through the fitted curve, subject to run and sample suitability. |
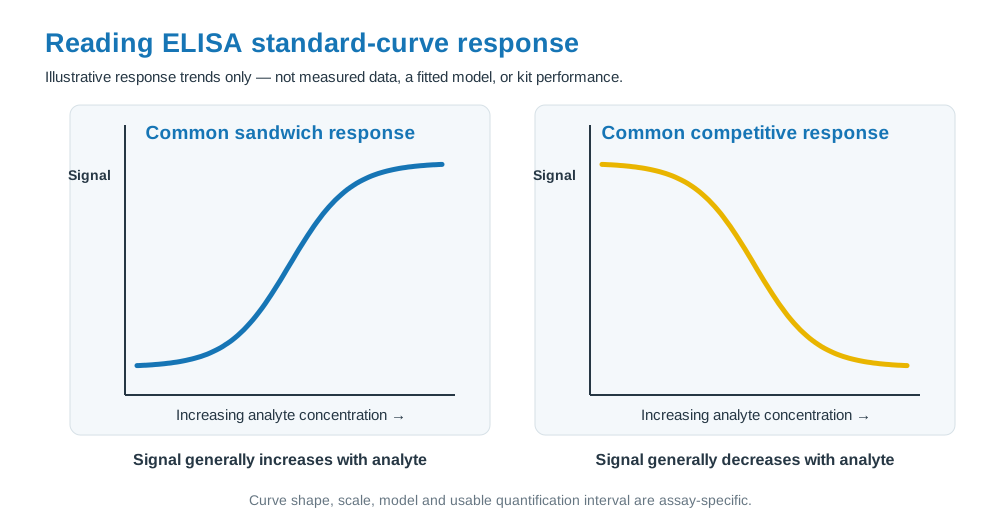
Many ELISA calibration responses are sigmoidal rather than straight lines across the full measuring range. Four-parameter logistic (4PL) fitting describes a curve with upper and lower asymptotes, a midpoint and a slope parameter. Five-parameter logistic (5PL) adds an asymmetry parameter and can accommodate some curves that are not symmetric around the midpoint. [1,2]
Neither model is automatically superior. A 5PL model has additional flexibility, but that alone does not demonstrate better quantitative performance; the model must be appropriate to the assay, calibrator data and validation evidence. Follow the kit’s stated fitting approach and software settings, including treatment of blank or zero calibrators. If software offers weighting, use the method’s documented settings rather than choosing weights simply to improve the appearance of a fit. Weighting is discussed as a general regression consideration in ICH M10’s chromatography section (§3.2.4); it is not prescribed there as a universal ELISA fitting rule. [1,2]
| Model | Practical interpretation | What not to assume |
|---|---|---|
| 4PL | Common sigmoidal calibration with four fitted parameters. | A visually good fit establishes reliable quantification at all concentrations. |
| 5PL | Adds a parameter allowing asymmetric sigmoidal behavior. | More parameters necessarily mean better results. |
| Linear fit | May be suitable for a justified portion of a curve or a method designed for it. | A full-range ELISA curve should always be linear. |
| No model specified | Some instructions ask users to plot standards and draw a best-fit curve without naming a model. | Do not assume any model is equally acceptable. Ask which fitting approach supports the stated assay range and use a consistent, justified method. |
A logarithmic concentration axis is common in display and fitting workflows, but log-scaled plotting does not validate a linear relationship. Because log(0) is undefined, zero points need special handling in logarithmic displays. More importantly, ICH M10’s ligand-binding guidance excludes the blank sample from calibration-curve parameter estimation [2]. Follow the selected assay’s instructions for handling blank and zero calibrators; do not assume every research kit uses the same fitting convention.
A curve can look smooth and still give unreliable concentrations. A high coefficient of determination (R²) is not, by itself, proof of quantitative accuracy. Rather than relying on a universal R² cutoff, evaluate the run against the kit’s specified criteria: back-calculated calibrator concentrations, replicate behavior, blanks, control samples, response direction and software flags, where relevant. Quantitative performance deserves particular attention near the supported LLOQ and ULOQ, where uncertainty may be greater despite an acceptable overall fit. ICH M10’s ligand-binding-assay guidance focuses on calibration-standard acceptance and quantitative performance, not an R² threshold. [2]
| Check | Question to ask | Why it matters |
|---|---|---|
| Standards | Were standards prepared correctly, within their assigned concentrations, and accepted under the method? | Incorrect or failed standards can bias every unknown. |
| Replicates | Are replicate responses consistent under the study’s predefined criteria? | Large variation may make an interpolated concentration unstable. |
| Controls | Do independent controls or QC samples meet the run’s criteria? | A plausible curve alone does not establish run acceptability. |
| Fit and residuals | Are there systematic deviations or rejected calibrators that require explanation? | A high R² or smooth curve can hide local bias. |
| Range and flags | Is the unknown response inside the supported interval and free of software warnings? | Interpolation outside supported limits is not validated quantification. |
Do not apply a single universal acceptance threshold to every research-use ELISA. The appropriate limits depend on assay design, intended use and available performance evidence. ICH M10’s regulatory criteria are not universal requirements for research-use biomarker assays. [1,2]
For an acceptable unknown within the supported interval, use the specified curve fit to obtain the concentration in the material actually placed into the assay well. If the sample was diluted, multiply the accepted measured concentration by the total dilution factor to report an original-sample equivalent, subject to appropriate dilution and matrix suitability. [1,2]
| Fictional result | Calculation | Interpretation |
|---|---|---|
| Measured diluted sample: 75 pg/mL; total factor 4 | 75 × 4 = 300 pg/mL | Original-sample equivalent is 300 pg/mL if the measured 75 pg/mL result and dilution are acceptable. It is the measured diluted result—not necessarily the original-sample equivalent—that must lie in the supported assay interval. |
| Measured diluted sample: 5 pg/mL; total factor 4 | 5 × 4 = 20 pg/mL | 5 pg/mL is below the fictional 10 pg/mL LLOQ; multiplying does not make it a reliable exact concentration. |
| Measured diluted sample: 450 pg/mL; total factor 2 | 450 × 2 = 900 pg/mL | 450 pg/mL is above the fictional 400 pg/mL ULOQ; do not report 900 pg/mL as validated quantification. |
For serial dilutions, multiply individual dilution factors to obtain the total factor. For example, two sequential twofold (1-in-2) dilutions give a total factor of 2 × 2 = 4. A mathematically acceptable concentration does not prove that the dilution is permitted or that matrix effects are controlled. See ELISA Sensitivity vs. Detection Range for dilution-window arithmetic and Preparing Samples for ELISA for sample preparation.
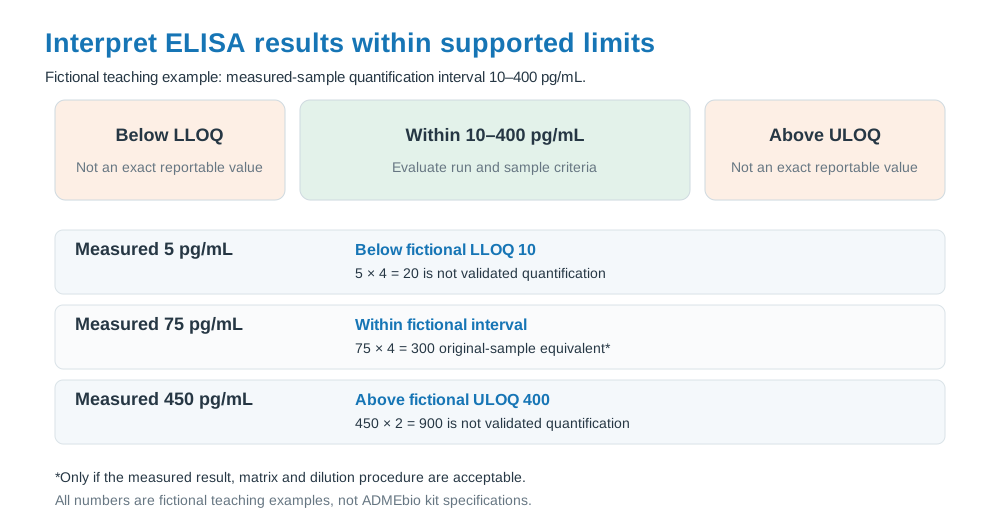
A signal below the detection limit does not prove that the analyte concentration is zero. A detectable response below the LLOQ does not establish a reliable exact concentration. Above the ULOQ, a reported value may be an extrapolation outside the supported interval. ICH M10 describes anchor points below the LLOQ or above the ULOQ that may improve curve fitting but are outside the quantifiable range and do not require calibration acceptance criteria [2]. Their presence does not extend the interval over which unknown samples can be quantitatively reported. Follow the laboratory’s predefined reporting rules and the kit’s instructions for any permissible repeat or dilution. [1,2]
If a sample is suspected to have very high analyte concentration but shows an unexpectedly weak signal, do not assume the low value is genuine. Certain assay formats can exhibit a high-dose hook effect. That troubleshooting scenario is covered in ELISA Troubleshooting: High Background, Weak Signal, and Variable Results; use the selected assay’s instructions rather than improvising a correction. [1,2]
No. A high R² alone does not establish accuracy, precision, acceptable calibrator back-calculation, or suitability of unknown samples. Evaluate the method’s full run criteria and relevant concentration regions; ICH M10 specifies calibration-standard acceptance checks rather than a universal R² cutoff for ligand-binding assays. [2]
Use the model specified and supported by the selected assay. 4PL is common for symmetric sigmoidal response; 5PL can represent asymmetry. Extra model flexibility is not proof of superior quantification. [1,2]
Not automatically. In the ICH M10 framework, the LLOQ is the lowest calibration standard in a method that meets defined performance criteria. A research kit’s lowest listed standard, by itself, does not establish that unknowns can be reliably quantified there. A fitted number outside the supported interval is not automatically reliable. Use the assay’s documented limits and predefined reporting rules. [1,2]
For a quantitatively acceptable measured result, multiply by the total sample dilution factor to obtain the original-sample equivalent. This arithmetic cannot validate an out-of-range measurement or an unsuitable dilution. [1,2]
Kits may use different antibody pairs, calibration materials, analyte forms, sample-matrix conditions and quantification intervals. A difference does not by itself identify which result is correct; review each assay’s documented measurement characteristics. [1,2]
Interpolation estimates concentration from responses within the assay’s supported calibration and quantification interval. Extrapolation estimates outside that supported interval; a software-generated number beyond the LLOQ or ULOQ should not be treated as validated quantification without appropriate evidence. [1,2]
Explore ADMEbio’s ELISA catalog and compare each candidate’s stated assay range, sample requirements, calibration instructions and available supporting documentation. Product pages may describe the curve-fitting approach under “Calculation of Results” and show “Typical Data & Standard Curve”; an example curve is illustrative and each run needs its own standards and acceptance checks. If the fitting method, quantification limits or sample-compatibility evidence are missing or unclear, contact ADMEbio with your target, species, sample type, expected concentration range and dilution plan so the relevant documentation can be reviewed.